Part 1 of a 2 Part Series……….

UK manufacturing remains one of the country’s most strategically important industries.
The sector supports approximately 2.6 million jobs, accounts for a significant proportion of UK business research and development, and generates hundreds of billions of pounds in annual product sales.
Yet manufacturers continue to face considerable pressure from rising employment costs, energy prices, skills shortages, supply-chain disruption and international competition.
The next significant improvement in manufacturing productivity may not come solely from buying faster machinery, employing more people or installing additional automation.
It may come from making better use of the information already being generated inside the factory.
Manufacturers do not lack data
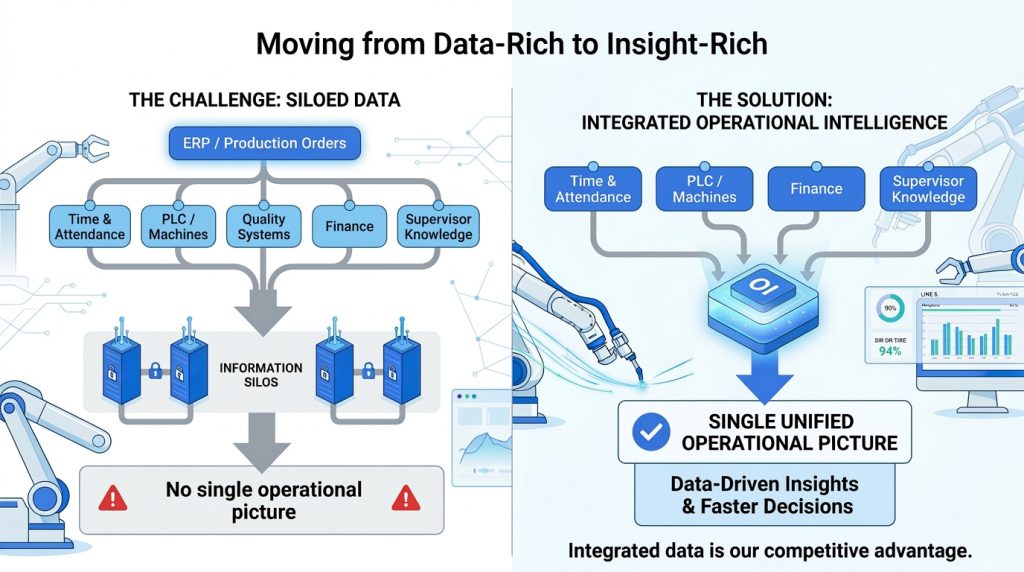
Every production environment creates large quantities of operational information.
ERP and MRP systems hold production orders, routings, standards, materials and planned quantities. Time and attendance systems contain working-time information. Machinery and PLCs produce performance signals. Quality systems record defects and rework. Finance departments maintain labour rates, overheads and costing data.
Employees and supervisors contribute another vital layer of information. They know why a job stopped, why a changeover took longer than expected, why materials were unavailable or why output fell below target.
The problem is rarely that this information does not exist.
The problem is that it is held across different systems, recorded at different levels of detail and made available at different times.
A manufacturer may know:
- The total labour cost for the month
- The number of employees who attended work
- The total output achieved
- The overall value of scrap
- The level of overtime worked
But that does not necessarily reveal:
- Which jobs absorbed the labour
- Which operations exceeded their standard times
- Where downtime occurred
- Why production was delayed
- Which products created the greatest rework
- How Work in Progress changed during the day
- Which customers, jobs or contracts delivered the expected margin
The business may possess all the individual pieces of information while still lacking a complete operational picture.
Data needs context
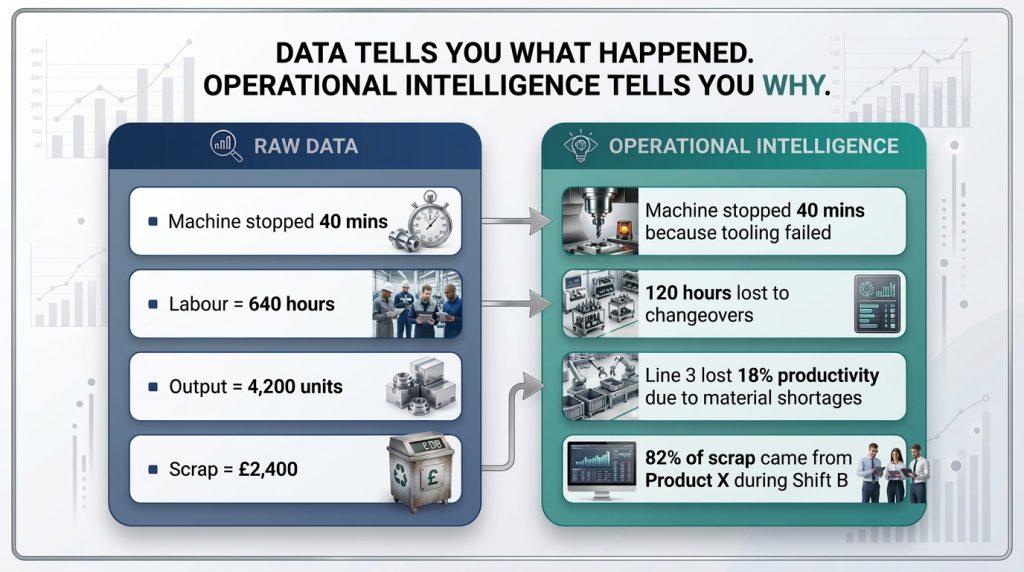
Knowing that a machine stopped for 40 minutes is useful.
Knowing that the stoppage delayed three jobs, created two hours of additional labour, affected a customer delivery and reduced the expected margin is far more valuable.
The same principle applies to workforce information.
Knowing that 80 employees worked an eight-hour shift confirms that 640 paid hours were available.
It does not explain how those hours were divided between:
- Productive activity
- Machine set-up
- Changeovers
- Maintenance
- Waiting time
- Rework
- Training
- Indirect work
Manufacturers therefore need to connect four essential dimensions.
What was planned
The order, routing, standard time, expected quantity, labour requirement, target cost and expected margin.
What actually happened
The employees involved, activities completed, hours consumed, quantities produced, machines used and interruptions encountered.
Why performance varied
Downtime, material shortages, quality failures, changeovers, resource constraints, skills issues or process inefficiencies.
What the variation meant financially
The impact on labour cost, production cost, Work in Progress, recovery, delivery performance and margin.
Until these dimensions are connected, management teams can spend more time debating whose figures are correct than deciding what action to take.
The limitations of lagging indicators
Traditional management reporting is largely based on lagging indicators.
These may include:
- Monthly labour cost
- Total production output
- Scrap value
- Overtime expenditure
- Gross margin
- Delivery performance
These measures remain important, but they usually show the final outcome after the opportunity to intervene has passed.
By the time a monthly report identifies a margin problem, the labour has already been paid, the material has already been consumed and the production delay has already occurred.
Operational intelligence provides the explanation behind the final result.
It can show:
- Labour consumed by job and operation
- Actual time compared with standard
- Productive and non-productive activity
- Machine interruptions
- Changeover performance
- Scrap and rework by product or process
- Work in Progress
- Output by employee, team, line or shift
- The reasons behind operational variance
This changes the management question from:
Why was last month’s margin lower than expected?
to:
Which jobs are moving outside their expected labour and production cost today?
That is a fundamentally different management capability.
Better data supports better management
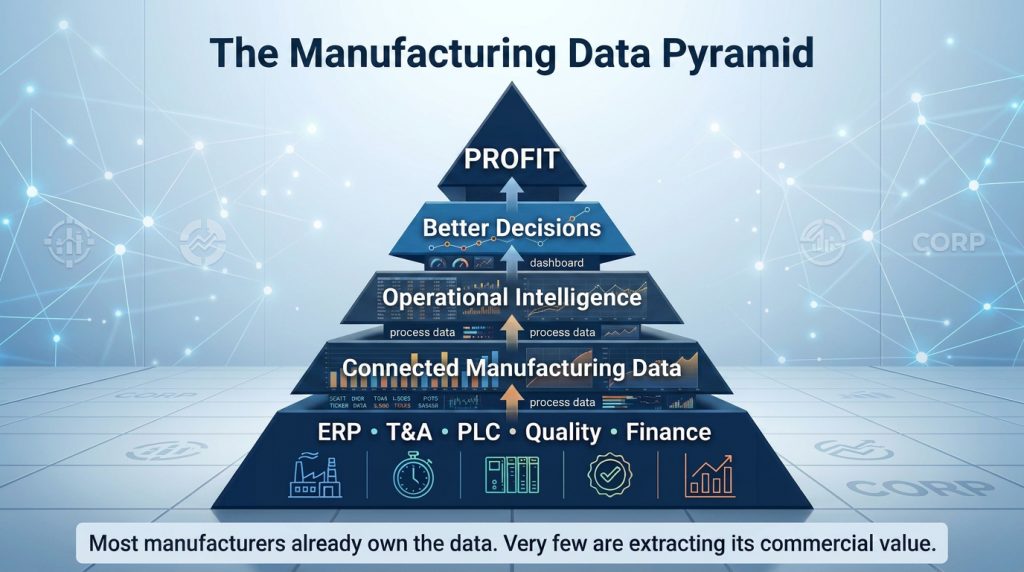
Continuous Improvement depends on measurement, analysis and response.
A manufacturer cannot consistently improve a process it cannot measure accurately.
Nor can it sustain an improvement if the information required to monitor the process arrives several weeks after the activity occurred.
When information is retrospective, improvement becomes reactive.
Managers investigate after the cost has been incurred, the production has been delayed and the margin has been reduced.
Operational data must therefore move at the speed of the operation.
The opportunity for UK manufacturing is not simply to collect more information.
It is to connect existing information more effectively, add the operational context behind it and use it before the opportunity to act has passed.
Because better performance does not begin with more data.
It begins with understanding what the data is really saying.


