When a question arises about working hours, pay, absence or timekeeping, an organisation needs more than a confident recollection. It needs a clear record of what happened, how a decision was reached and whether the same approach was applied consistently.
That is the practical value of defensibility. It is the ability to explain and support a decision using reliable information and a fair process.
Workforce records are created for practical reasons: to calculate pay, manage shifts, approve overtime and understand absence. But they can also become relevant when an employee raises a concern, a manager investigates an incident or the business needs to review how a policy was applied.
ACAS guidance says workplace investigations should be fair and objective, gather information from both sides and avoid starting from the assumption that someone is at fault. It also identifies attendance records and computer records as possible evidence in an investigation.
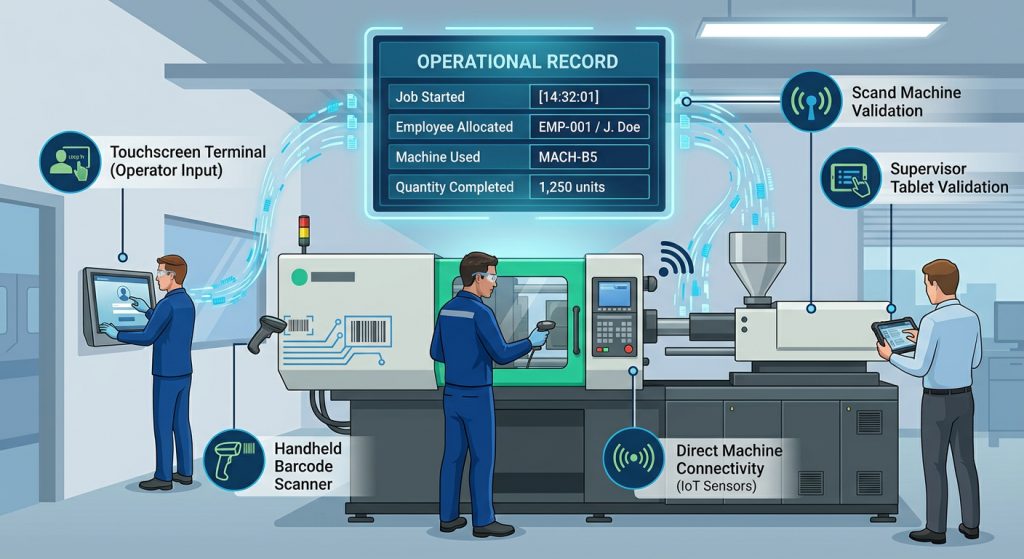
That makes the quality of routine records important. If information is scattered across paper timesheets, spreadsheets, emails and separate systems, it can take time to build an accurate picture. Gaps and inconsistencies can make it harder to explain what happened.
Everyday records can become important evidence
Workforce records are created for practical reasons: to calculate pay, manage shifts, approve overtime and understand absence. But they can also become relevant when an employee raises a concern, a manager investigates an incident or the business needs to review how a policy was applied.
ACAS guidance says workplace investigations should be fair and objective, gather information from both sides and avoid starting from the assumption that someone is at fault. It also identifies attendance records and computer records as possible evidence in an investigation.
That makes the quality of routine records important. If information is scattered across paper timesheets, spreadsheets, emails and separate systems, it can take time to build an accurate picture. Gaps and inconsistencies can make it harder to explain what happened.
Accurate time data supports better conversations
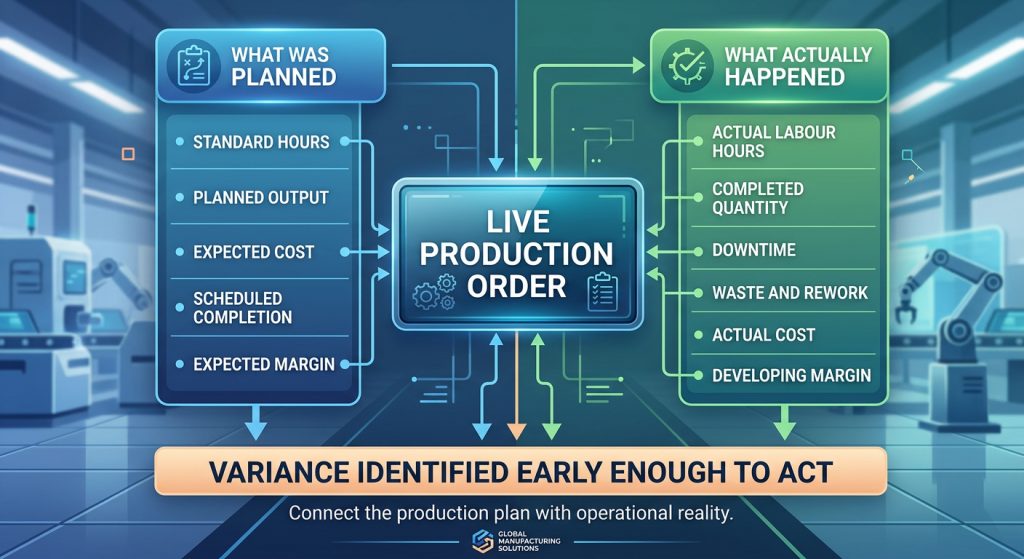
A clocking record on its own may not tell the whole story. Managers may also need to understand the shift that was scheduled, any authorised changes, approved overtime, an absence or a correction made to a record.

Bringing this information together helps managers ask better questions and respond to issues promptly. It can also help identify patterns in lateness or absence, while giving managers a clearer basis for a supportive conversation. ACAS recommends recording unauthorised absence and lateness, while also reminding employers to consider confidentiality, data protection and discrimination.
The aim is not to turn every minor discrepancy into a formal issue. It is to give managers dependable information so they can understand the circumstances and respond appropriately.
Records matter when pay is questioned
Working time records can also help explain how pay has been calculated. Government guidance on National Minimum Wage record keeping says employers need sufficient records to demonstrate that workers have been paid correctly. It recommends clear, consistent records that show working time and associated pay rates, and explains that the required detail can vary by worker and situation.
For organisations managing different shifts, overtime rates, allowances or working arrangements, it is useful to be able to see how recorded time connects to the rules used to calculate pay. That visibility can support internal checks and help the business respond to a query with relevant information to hand.

Consistency is part of a fair process
Good records are only one part of defensibility. Policies need to be clear, managers need to apply them consistently, and employees need an opportunity to explain their circumstances. Where a concern is investigated, relevant evidence should be reviewed fairly and kept confidential.
A system can help make information easier to find and apply. It cannot make a decision fair on its own. The process still depends on people using the information thoughtfully and following the organisation’s procedures.
Building a clearer workforce record
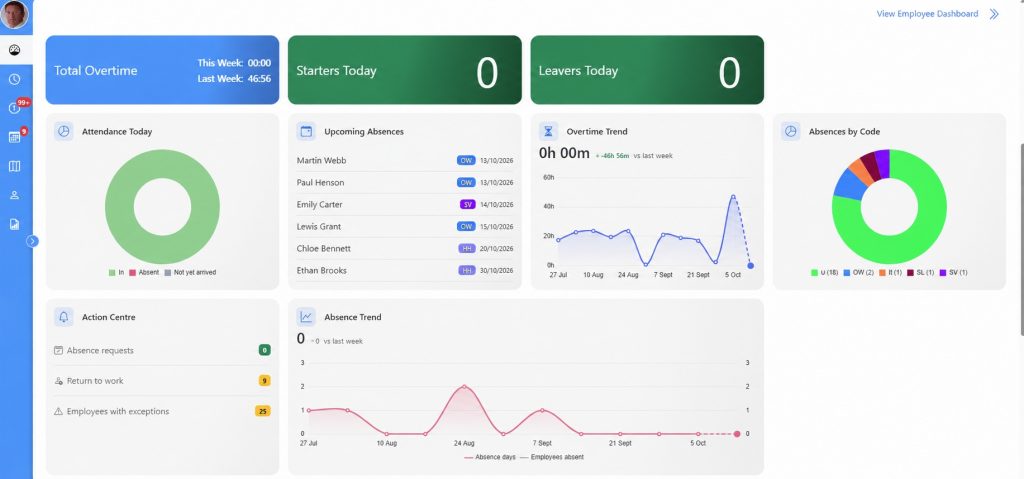
Ceequel Time & Attendance brings together clockings, shift information, absence and overtime within a configurable workforce system. Managers can review exceptions and approvals through Ceequel Hub, helping them see relevant information in one place and deal with issues in a more timely way.
For organisations, that can mean less time piecing together records and more confidence in the information behind workforce decisions.
Defensibility is not created when a problem appears. It is built through accurate records, clear policies and consistent decisions made every day.